
By Pierre Chandon
In the introduction to the Behavioral Economics Guide 2020, Colin Camerer reports a conversation with Mark Halpern, the director of the UK Behavioural Insights Team, in which Halpern pointed out that academic research, unlike government-sponsored research, does not have an obligation to publish all results, leading to the well-known publication bias. In addition, academic research, including most of mine, is typically conducted online or in laboratory settings in which participants know that they are being monitored, leading to the Hawthorne effect. Furthermore, lab-based studies, including my own, do not usually last long enough to study repeated behaviors and the possible decay of effects over time.
Although we have long suspected that these factors may lead academic publications to be sometimes too optimistic about the effectiveness of the interventions that they are studying, it has been difficult to estimate the size of this bias. The comparison of two recent studies of the effects of simplified nutrition labels, one conducted in a lab and one conducted as a randomized controlled trial (RCT) sponsored by the French government, suggests that the gap between the effect sizes reported in academic research and what happens in the real world may actually be very large, at least when it comes to healthy eating nudges.
An Incentive-Compatible Lab Study of the Effects of Simplified Nutrition Labels
Simplified nutrition labels on the front of food packages and drinks are meant to put nutrition information under the nose of shoppers to help them make healthier choices, quickly and regardless of surrounding distractions. Surveys have shown that consumers like the idea of simplified nutrition labels and lab and field studies have suggested that they help identify the healthiest options, but do they really influence food purchases?
A recent, well designed lab-based study tackled this question by asking participants to shop for food for their households using a paper catalog of 290 products, which included the full denomination of the product, color pictures, prices, and bar-code, but excluded nutrition labels. With a bar-code reader, the participants could access the information typically available when shopping online (e.g., the list of ingredients as well as nutrition information). To make the experiment incentive compatible, the participants were informed that they would have to buy a randomly determined subset of the products that they chose. After initially purchasing food for a day, participants were unexpectedly asked to make a second “shopping trip” from the same catalog, but now from a catalog with a simplified nutrition label implemented on all products (or the same catalog without any nutrition label for the control treatment).
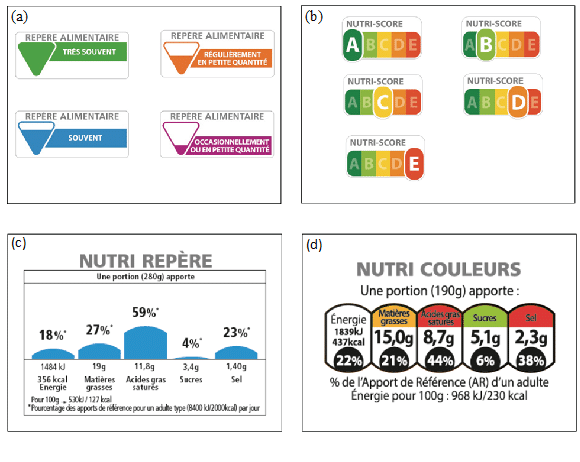
The authors tested five nutrition labels. One of them, NutriMark, was not tested in my study and so I will not discuss it further. Two of the labels, SENS and Nutri-Score (the top row) provided a single summary score. Two others, Nutri-Repère and Nutri-Couleurs (adapted from the British traffic light label), on the bottom row, provided detailed information about calorie, fat, saturated fat, sugar and salt content. The authors found that all four labels significantly improved the nutritional quality of the basket of foods purchased. The most effective label was Nutri-Score, followed by Nutri-Couleurs, Nutri-Repère, and SENS.
A Randomized Controlled Trial in 60 Supermarkets
The French Ministry of Social Affairs and Health asked my co-authors* and I to examine the effects of nutrition labels in “real life”. We designed and conducted a randomized controlled trial to test the effects of the same four labels in 60 French supermarkets over a 10-week period. We fixed 1.9 million labels on 1,266 food products and analyzed the nutritional quality of more than 1.6 million purchases. The results were published in the Journal of the Academy of Marketing Science in April 2020.
Each of the labels was tested during 10 weeks in 10 French supermarkets chosen randomly. Twenty supermarkets were included as the control group. Shoppers were informed about the study in each supermarket through leaflets and displays. Stickers were placed on the packages of food products in four categories: freshly prepared foods (e.g. pizzas, quiches), pastries (e.g. croissants, brioches), bread (e.g. sliced breads, baguettes) and canned ready meals (e.g. cooked beans, ravioli). We categorized all the brands into three tiers according to their nutritional quality within each category, with the top tier being the healthiest. Some brands were not labelled because they refused to participate in the study.
We used data on purchases from supermarket loyalty cardholders during the study period in 2016, and during the same time period the year before and analyzed them with the same statistical approach as in the lab study, a standard difference-in-differences analysis. We examined whether the changes in purchases between 2015 and 2016 were different in the test supermarkets compared to the control supermarkets where no labels were put in place. We used the same performance metric, the nutritional quality of the shopping basket of foods. Nutritional quality was assessed using the well-known Ofcom/FSA nutrient profiling score developed by the British Food Standards Agency which rates the nutritional quality of any food on a continuous scale from -15 (best) to +40 (worst).
Do Field and Lab Results Agree?
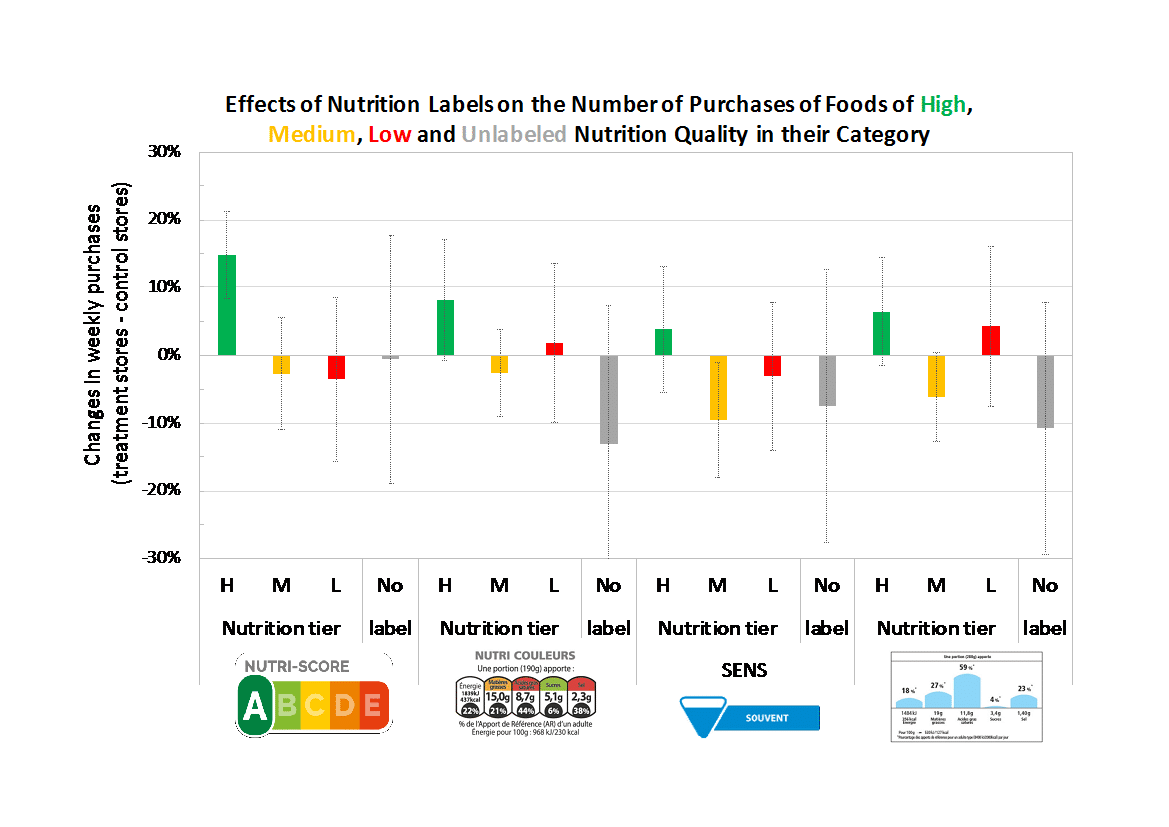
First, the good news. The correlation between the effectiveness estimates found in both studies was 0.82. The field study replicated the results of the lab-based study and found that Nutri-Score was the most effective label. Nutri-Score led to a 2.6 percent improvement in the average nutritional quality of consumers’ shopping baskets overall. As can be seen in the chart below, Nutri-Score also had the largest positive impact (+14 percent) on the selection of products with the highest nutritional quality in their category. Just like in the lab study, the second most-effective label was Nutri-Couleur (a version of the Multiple Traffic Light). The order of the third and fourth label was different than in the lab study, but it doesn’t really matter because the last two labels were clearly dominated by the first two.
When it comes to effect sizes, however, the results of the field study were in stark contrast with those found in the lab. On average, the size of the effects of nutrition labels were 17 times smaller in our field experiment than in the lab study. For Nutri-Score for example, their estimate of the change in basket FSA score was -2.65 FSA points, which is 18.6 times larger than our estimate of -0.142 FSA points.
The much lower effect sizes that we observed in the field could be driven by any of the differences between the two studies. First, the lab study examined two consecutive purchase decisions whereas our field study looked at multiple purchase decisions over several weeks. It is possible that initial interest for healthier products may have decayed over time as people reverted to their habitual behaviors. Another important difference is that their study was a “framed natural experiment” rather than a “natural experiment” like ours, in which people were unaware that their choices were being studied. In the food domain, and especially for nutrition-related decisions, there can be a considerable difference between what people choose when they are being watched versus when they are not.
Does It Matter?
Clearly, the effects of FOP nutrition labels on the nutritional quality of the foods purchased in real-life grocery shopping conditions were disappointingly modest compared to what we would have expected from the lab study. This matters when simulating the effects of a policy that would make nutrition labels mandatory. For example, a study that relied on the effect sizes reported in the lab study estimated that approximately 7,680 deaths (3.4% of all deaths from diet-related non-communicable diseases in France) would be avoidable if the Nutri-Score was implemented. Clearly, it would be useful to rerun these simulations with our much smaller estimates of the effects of Nutri-Score.
On the other hand, we need to put these small effects into perspective. Even tiny changes in the nutritional quality of one’s diet can have significant health outcomes. For example, a one-point increase in the FSA score computed over a total diet is associated with a 16 percent higher risk of obesity among men. Also, the real impact of these labels may be on the supply side, as executives reformulate foods to gain better scores or shift advertising spending towards their healthier foods. Somewhat ironically, given the small effects that we found, many food executives worry that FOP nutrition labels will drastically alter the food industry at its core.
Overall, what this tells us is that (well-designed and conducted) lab studies are useful in revealing the direction of effects, in distinguishing when one intervention works better than another, and in ranking various interventions by order of effectiveness. However, to be able to estimate the population-level impact of nudges, especially for repeated behaviors, field experiments remain the gold standard.
*Pierre Dubois, Olivier Allais, Céline Bonnet, Patrice Bertail, Pierre Combris, Saadi Lahlou, Natalie Rigal, Bernard Ruffieux
Pierre Chandon is the L’Oréal Chaired Professor of Marketing, Innovation and Creativity at INSEAD and the Director of the INSEAD-Sorbonne Université Behavioural Lab. Watch his TEDxINSEAD talk on Epicurean nudges.