
By Bhargav Shetgaonkar
Imagine waking up late, rushing through your morning coffee, and missing your bus/train to work. We’ve all been there at some point, and despite what our local transport authorities tell us about retrofitted, modern policies we think that the existing system is costly, inefficient and unsafe, at best.
The variability and uncertainty that sometimes comes with using transit can lead to a range of commuting impedances and barriers, which can easily result in commuters defaulting to driving alone on a day-to-day basis. These decisions however have implications for cities such as Los Angeles, where high vehicle ownership and single occupancy vehicle (SOV) use result in LA being the sixth most congested city in the US.
The usage of mass public transportation services benefits LA in the form of reduced traffic (especially during peak hours), saved fuel emissions, and in turn better community health and well-being. However, there has been increased public concern about hygiene and safety, resulting in public transportation ridership declining since the COVID-19 pandemic.
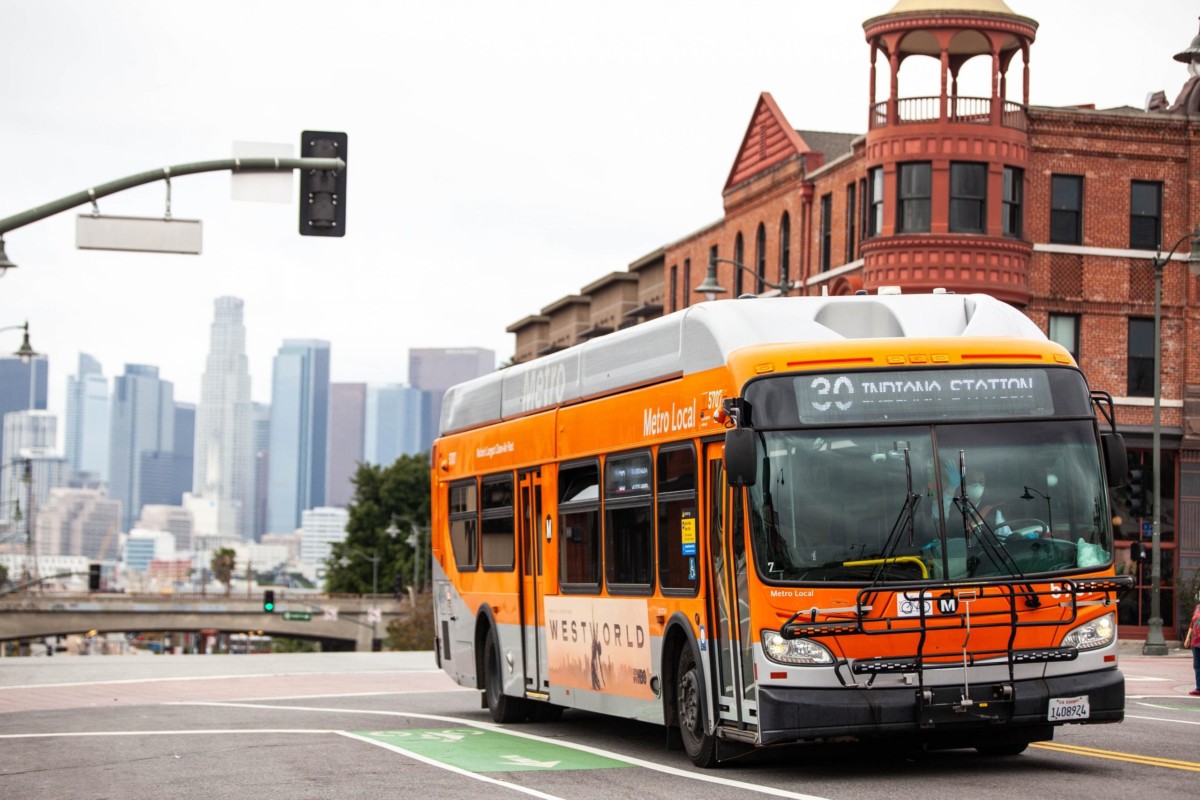
image from ‘The Source – LA Metro’
Only a few hundred thousand commuters utilize LA’s metro rails and buses on weekdays, which is a small percentage of total rider capacity and resident count. Moreover, this demand has shown a net positive price elasticity between the fiscal year 2015 to 2021 i.e. even though the average price per ride has gone down, so has the ridership (demand). As seen in the below chart, the ridership in 2021 is less than half of 2015 at almost 1/8th the price per ride. This can largely be explained by the invisibility of ticket price-based discounts to incentivize riders to ride more. Commuters may often overlook discounted services in comparison to direct rewards as cash or coupons.
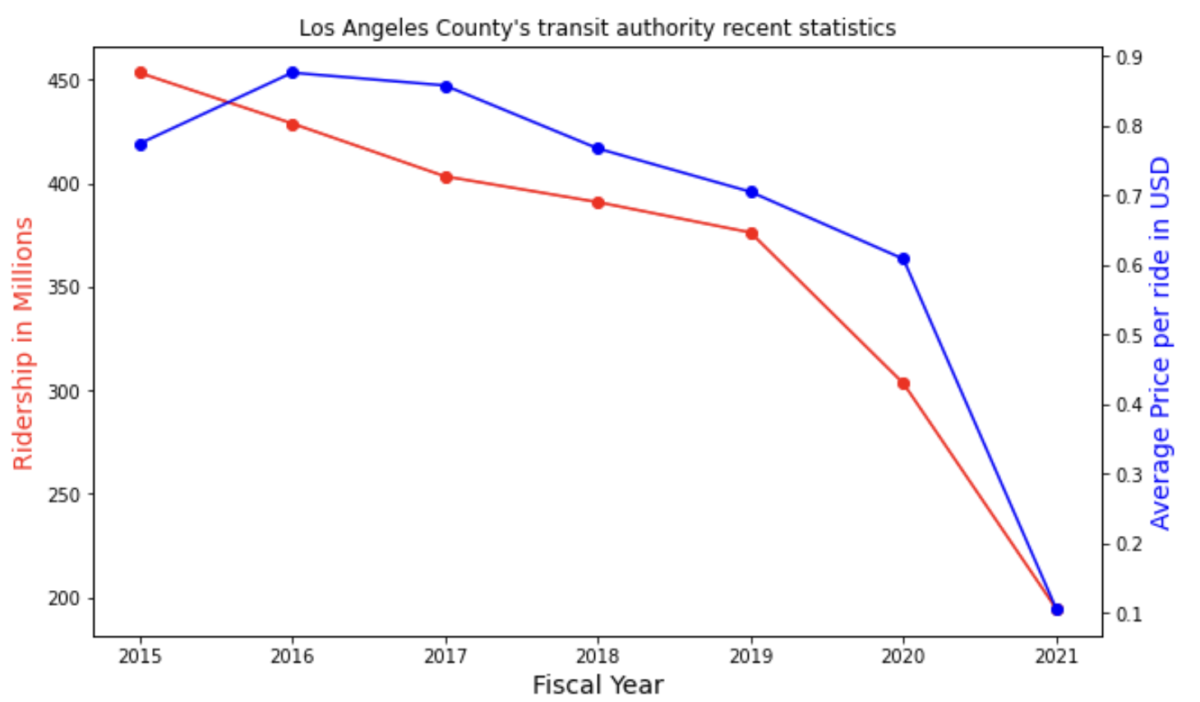
Figure 1: Price elasticity of ridership between FY 2015 and FY 2021
With Metro services mainly being powered by CNG (Compressed Natural Gas) and electricity, this also presents an opportunity to nudge LA commuters to alternative, low-emission options using direct incentives. This will contribute to a net lesser carbon footprint than SOVs or personal rides to work. Moreover, as a large portion of the American workforce returns to the office and transit innovation continues to evolve, there is room for a fresh start, where new commuting routines can be explored and incentives provided to motivate commuters to utilize more sustainable commuting modes.
Incentives, Anchoring, and Commuter Choice
Financial incentives have often been used as a means of “nudging commutes” in the transportation demand management (TDM) field. Studies conducted by transportation authorities in Chicago, San Francisco, Seattle, and similar cities, saw riders altering commute patterns when given financial incentives. These had a direct impact on commuter spending, miles walked, and macro traffic patterns. These incentives served more than a simple nudge towards sustainable choices due to the direct price effect on travel costs. The net reduced cost of travel as a service has a direct impact on rider traffic.
A vast body of literature also indicates that prior knowledge largely impacts our perception of objects we see or are offered. If you walk into a bakery and the first thing you see is a $40 slice of cake, your perception of the shop is set with an ‘expensive’ label. Here, you might think of a $12 brownie to be a good deal while the same brownie at a local grocery store might seem too expensive at the same price. Similarly, our mind builds perceptions based on historic data or experiences. We use this effect of anchoring to study whether the same applies to monetary incentives.
Using these insights as our basis, we aimed to better understand 1) the price point at which LA commuters were willing to choose to take public transit and 2) how anchoring affects willingness-to-accept (WTA) financial incentives within the context of public transit in LA. We hypothesized that giving people money to choose public modes of transport would effectively change their behavior and eventually, preferences. To that end, we aimed to quantify WTA by conducting experimental research with 380 residents of Los Angeles in a CloudResearch study.
When Incentives Work
We asked residents if they would take the train/bus to work instead of their present commute method when given incentives between $2 and $16. There were also custom incentive choices for those that answered ‘No’.
Firstly, when looking at the acceptance point, or the price point at which LA residents were willing to choose to take transit. This averaged around $7. For each individual, we explored variables such as age, ethnicity, gender, education, salary, distance to work, pre-pandemic, and current commute frequency to work and derived their ‘target incentive’ i.e. the lowest price at which the person was willing to change their commute behavior to use public transport.
We also saw that some groups were more likely to change their transportation behavior at different incentive values when compared to others. For example, individuals in their 50s and males show a higher target incentive than other groups. Meanwhile, other factors such as ethnicity, education, commute frequency, distance to work, and income levels did not display causation with target incentives in our study.
Anchoring and Willingness to Accept
Secondly, and to test anchoring effects, respondents were randomly and equally divided into two treatment groups – ‘Low to High’ and ‘High to Low’. The first group was shown cash incentives in $2 increments starting at $2 to $16, and starting at $16, down to $2 for the latter group.
Low Anchors
Some notable features of Figure 1 are the initially high acceptance rate, along with 2 steep climbs in the rate of acceptance. When we moved from $8 to $10, suddenly the chances of acceptance increased drastically, and similarly when we moved from $16 to custom values (greater than $16) in which users can enter whatever amount they deem fit.
This tells us two things. Firstly, the simple $2 incentive saw a whopping 51% probability of acceptance when shown first. Another takeaway from this group is that participants valued double-digit incentives greatly when compared to single-digit ones, but their set custom incentives the most.
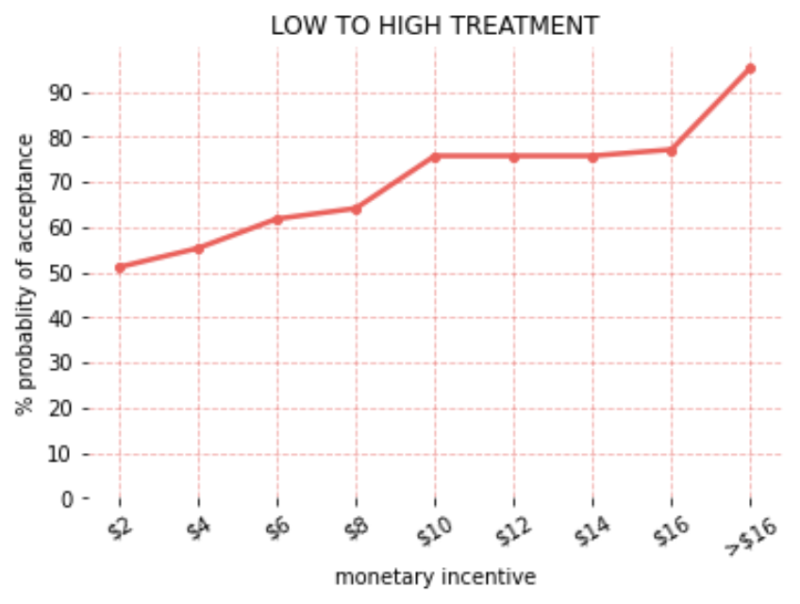
Figure 2: Acceptance Rates for the Low-to-High Condition
High Anchors
When it came to the ‘High to Low’ treatment group, we saw a decreased chance of acceptance as we moved to lower values after starting at $16. The lowest incentive to which they say ‘yes’ becomes their target incentive.
The steepest percentage change shown in Figure 2 is the region between $10 and $8 which reinforces that participants largely valued double-digit incentives. The custom incentive saw the maximum probability of acceptance. However, we saw that for this group, the $2 incentive experienced meager chances of acceptance at about 4% due to the anchoring effect of the $16 shown first.
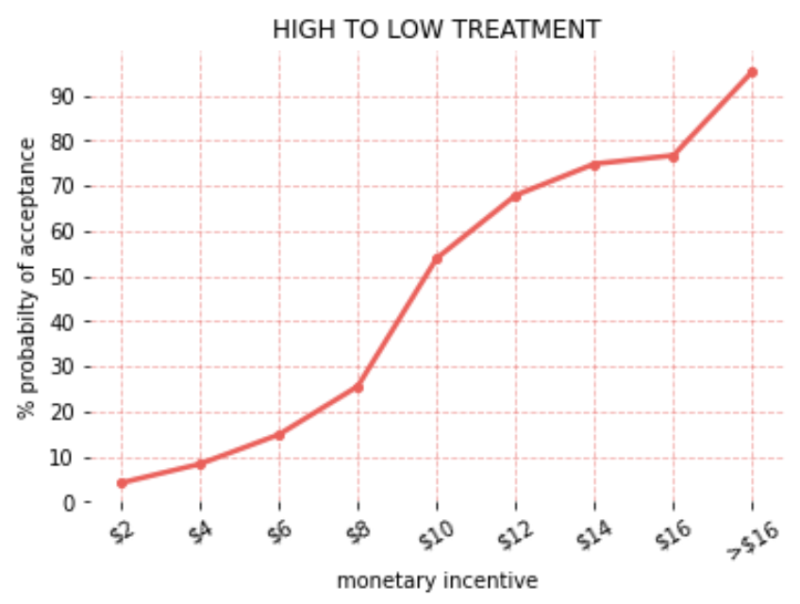
Figure 3: Acceptance Rates for the High-To-Low Condition
WTA and Its Implications
In summary, we have three key findings:
- $2 can change travel behavior for most people. Many LA residents were willing to take transit if given $2, with average target incentives around $7. Thus, simply starting with a $2 incentive resulted in over 50% of participants being willing to choose a more sustainable commuting mode.
- Anchoring is important. People experience the effect of anchoring when shown incentives. In the case of moving incentives, changing to a double-digit value (i.e. $10) attracts the most attention with an average acceptance rate of ~65%. This reveals several aspects of our perceptions based on prior knowledge. In practice, offering $10 per commute may not be feasible too when the rate of acceptance only increases by 14% at five times the cost of $2.
- Custom incentives allow you to reach those less responsive to incentives. We notice that custom incentive values garner a lot of attention but at the same time are an impractical solution at scale for transit companies and incentive distributors.
We saw the effect of anchoring at play from the above results. One anchor was set by us in the form of the incentive first shown to the respondent. The second anchor was that of our prior knowledge/bias towards double-digit incentives. Interestingly, participants associated $10 with a significantly higher value than $8, which has very similar purchasing power. It attracts our attention more because of an irrational belief in double-digit incentive values. These anchors affect the decisions of transportation choices.
This $2 incentive per commute gives us a favorable probability of changing the transportation behavior for a majority of residents of Los Angeles. Increasing ridership, in the long run, can help recover the cost of this investment to the authority and foster a healthier community. The 2021-2022 spending plan on California transportation-related programs provided a budget of $31.7 billion including Caltrans, CHP, DMV, and HSRA majorly funded by the state’s General Fund. Activities such as the Zero-Emission Vehicles Package are well-intended projects that target year-on-year reduced carbon footprint of the service. However, simple and intuitive solutions to incentivize ridership for residents can help achieve an equitable goal.
In an age where solutions to urban traffic and pollution are electric vehicles, expensive infrastructure, and underground tunnels, a more intuitive approach to attractive public transportation services may do the trick. After all, if you’re still running late to work, low on caffeine, and missed the ride you wanted – a $2 reward is only taking you upwards.
This study was conducted by Duke University’s Center for Advanced Hindsight (CAH) – Government Team and led by Joseph Sherlock & Shaye-Ann McDonald, along with Los Angeles Metropolitan Transit Authority (LA Metro)’s Office of Extraordinary Innovation.
This article was edited by Shaye-Ann McDonald.
Bhargav is a Graduate student in Artificial Intelligence at Duke University’s Pratt School of Engineering. He is a Research Assistant at the Center for Advanced Hindsight focusing on statistical testing and behavioral research in transportation and sustainability.